

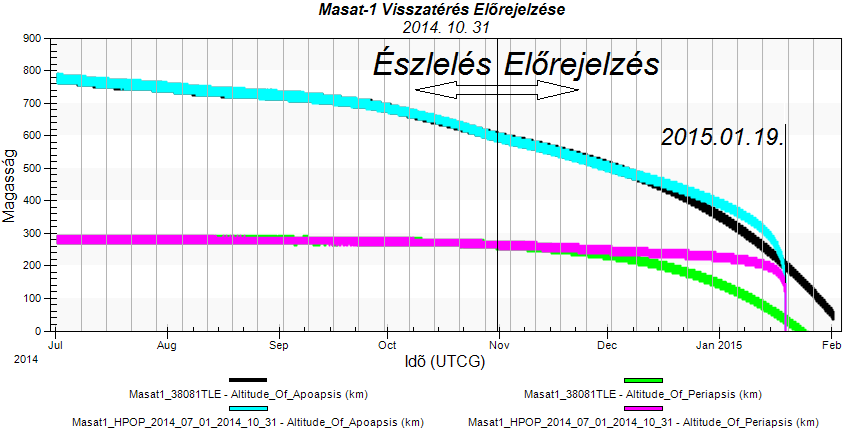
The figure below shows the evolution of the observed and predicted perigees and apogees. The black and green curves were plotted based on the TLEs, the cyan and magenta curves are based on the physical simulation. The thickness of the curves is due to the short term fluctuations of the data within a single orbit.
The TLE based data in the observation period was generated using TLEs updated twice per day, so these are practically observation data and can be considered reliable.
The HPOP simulation is based on a physics model which calculates the orbit of the satellite by integrating the forces acting on it over time. HPOP uses a partial gravitational model, the most recent available NRLMSISE atmospheric model, and observed space weather data which is updated daily. The atmospheric model provides the density of the atmosphere – which is a primary factor in the evolution of orbit altitude – based on observed space weather, season, time of day, geographical location, and altitude. Thus the model is after tuning of the drag coefficient able to reproduce the observed data over the observation period without further tuning.

During prediction we let the simulation advance further using the tuned drag coefficient; however this coefficient may change significantly in the remaining section below 300 km altitude. This is caused by changes in the rotation of the satellite due to increasing atmospheric forces, and changes in the chemical composition of the atmosphere. Additionally there is also an uncertainty in the predicated density of the atmosphere and the forecast space weather data. Due to these factors there is as a rule of thumb a +/-15% uncertainty in the remaining lifetime regardless of its extent.
The uncertainty may be decreased with significant additional effort if the orbits of the satellites launched at the same time, especially of the 1U CubeSats, are observed and processed, which – as surface characteristics of 1U CubeSats are quite typical – can be used to predict the changes of the drag coefficient with decreasing altitude. However the uncertainty cannot be decreased by even a single order of magnitude, as it is limited by uncertainties in the available atmospheric model and forecast space weather data.
The table below summarizes the results of the current and former predictions.
The final conclusion is, that based on the physical simulation matched to the data from the observation period, the expected date of the reentry is 13th of January 2015. Considering the uncertainties discussed above reentry is expected to take place between 6th of January and 19th of January 2015.
| Start of observation period | 2014.07.01 | 2014.08.30 | 2014.10.04 | 2014.10.23 |
| Date of prediction (end of observation period) | 2014.10.31 | 2014.11.09 | 2014.12.02 | 2014.12.02 |
| Expected date of reentry | 2015.01.19 | 2015.01.30 | 2015.01.11 | 2015.01.13 |
| Remaining lifetime +15% | 2015.01.31 | 2015.02.11 | 2015.01.17 | 2015.01.19 |
| Remaining lifetime -15% | 2015.01.07 | 2015.01.17 | 2015.01.05 | 2015.01.06 |
| Drag coefficient from matching | 2,85 | 2,88 | 2,79 | 2,70 |


Popular posts


